Tastelweb: the sensory solution
Tastelweb©
Discover Tastelweb© in video !
Goals
Position
. Position my products on a market
. Differentiate my products within the same range
Profiler
. Characterize my product profiles
. Set profile objectives to achieve
Select
. Identify and select batches for blending or recipes
. Classify, note for purchases, assortments
Evaluate (product conformity / quality)
. Evaluate my products throughout my development process
. Integrate this information into a continuous improvement check
. Measure the life cycle of my products (stocks, at points of sale)
. Evaluate the impact of a development process, a new tool or supplier
Centralize, share
. Archive my evaluation notes (or tasting notes)
. Share in an understandable way
Description
Classic Profiles - Treatments
. ACP (normed & non-normed) 2D-3D-interpreted
. CAH, group assignment
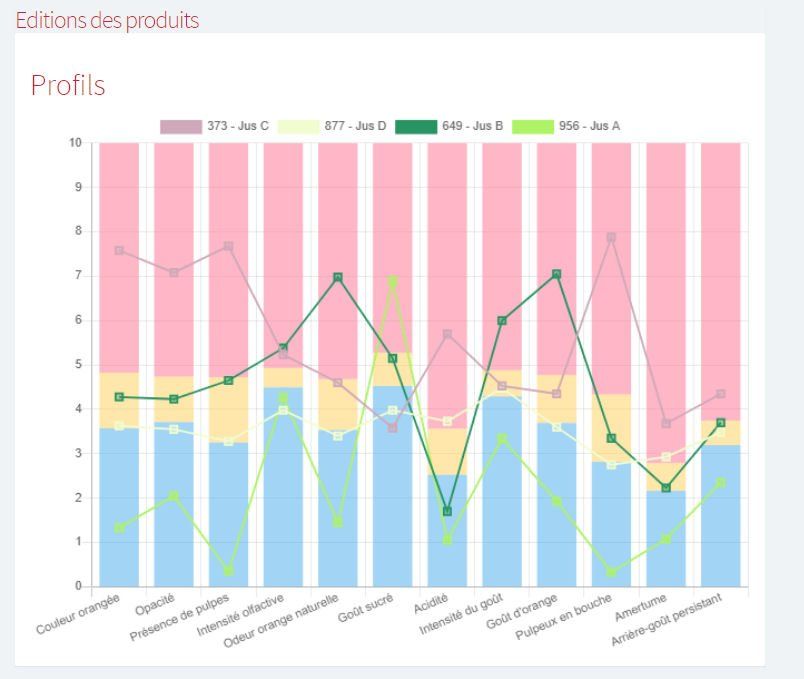
. Star charts, profile, histogram
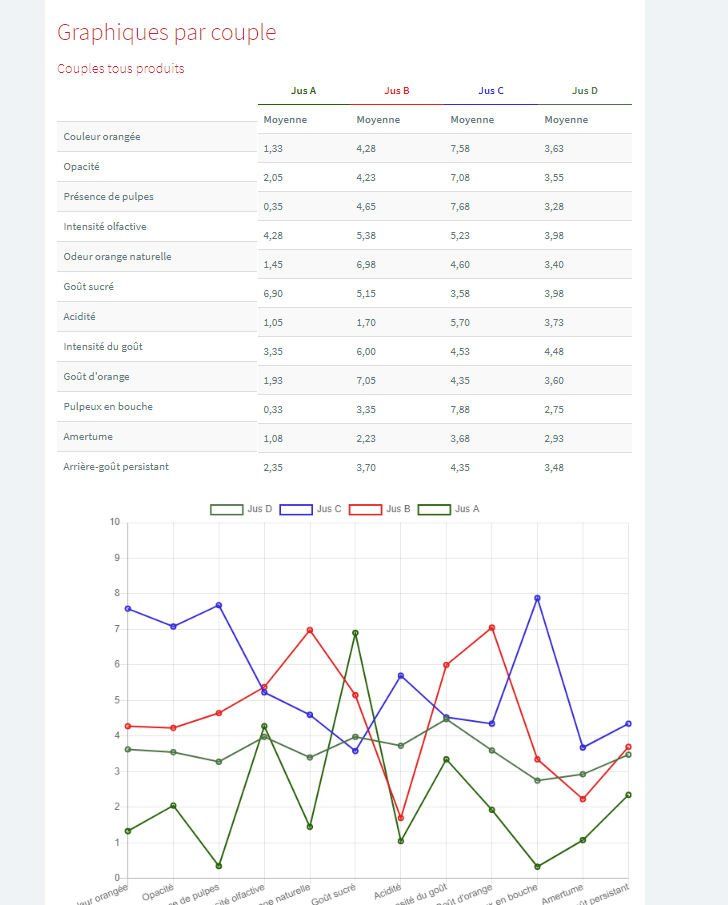
. Product comparison
- adequate test automatically applied
- normality tests, non-parametric stats (Willcoxon, Friedman)
. Anova, comparison of means (ppds, Duncan, Newman&Keuls)
. Sorting comments, individual notes
. Addition of identification factors (site, process, ingredient, etc.)
. Link sensory description (profiles) with instrumental data
. Session aggregation and comparison
. Panel management
- follow-up of deviations: positive, negative, relative, etc.
- consensus…,
- performance: discrimination, reproducibility, etc.
- ACP panelists …
Profile pivot© - Treatments
. Qualifier counts
. Groupings by frequency or by synonyms
. Product representations
- histograms, AFC products, panelists
. Product comparison
- significance tests
Triangular – Treatments
. Alpha & beta risks
. Comments
Profile Napping (Profile Plan)
.Entry on free or imposed grid
- on stages of maturation (wines), on two-dimensionalities
.Product comparison and distance calculations
.Sorting and analyzing comments
Profil CATA (Check All That Apply)
. Proposal ticks - neutral, positive, negative
. Frequency analysis and graphical representations
. Calculations of material differences by product
Qualitative profile
. Input on qualitative scales
- qualified intensities, qualified defects, aroma wheels, etc.
. Frequency analysis and graphical representations
. Assignment of summary results
PDO - PGI approvals
. Entry on qualified scales (defects absent, weak, average, etc.)
. Frequency analysis and graphical representations
. Minutes of product conformity
Product testing
. Input on various questions: Multiple choices, Scale questions, Multiple answers, Free questions (Texts, Values, Dates), Conditional choices
. Frequency analysis and graphical representations
. Analysis of the Scale Questions data.
. Textual analysis of open-ended questions.


